![]()
The Chemical Transformation Simulator (CTS) module for prediction of transformation products is built on ChemAxon’s Metabolizer application (Pirok, 2012). In Metabolizer, reaction products are predicted using a library of reaction schemes. Each reaction scheme is assigned a fixed rank within the library. Ranks are a dimensionless measure of the rate of the reaction scheme relative to other schemes in the library. The ranks are used to calculate a “formation” of the product(s) formed according to the scheme. This formation is then used to calculate the fractional “production” of each product.
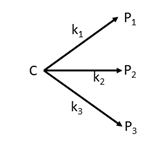
The algorithm implemented in Metabolizer is based on first-order transformation kinetics and is best illustrated with a simple example. Consider a parent chemical C which is transformed into three possible products, P1, P2 and P3, through reactions with rate constants k1, k2 and k3:
The overall rate of change in the concentration of the parent chemical is given by:
![]()
The rate of change in the concentration of each product Pi is given by:
![]()
These equations can be integrated to give the concentration of the parent and the transformation products as a function of time:
![]()
![]()
where [C]0 is the concentration of the parent at time zero. These two equations can be combined to show that at any given time, the fraction of the total product formation in the form of product Pi is given by:
![]()
This equation can be generalized for transformation of a chemical that is transformed according to Nr reactions as follows:
![]()
If rate constants were available for each transformation reaction, it would be possible to calculate an exact percent production for each product using this equation. In general, however, neither measured rate constants, nor algorithms to estimate rate constants are available for many transformation reactions.
In Metabolizer, an algorithm has been implemented to approximate a fractional production of each predicted product by categorizing the rate of each scheme with an integer rank on a scale of one to seven. A rank of seven is assigned to the fastest transformation reactions and a rank of one is assigned to the slowest reaction schemes. In the Metabolizer algorithm, the unitless “formation” value for product i (fi) is defined as the number 7 raised to the power of the rank for the scheme that generates product i:
![]()
These “formation” values are analogous to rate constants. If product i is a first-generation product, the “production” of product i is calculated according to the following equation:
![]()
where Np is the number of products formed from all schemes that transform the parent molecule. If product i forms from another product k, then its production will be a fraction of Pk; therefore, the production of product i is calculated as follows:

The Metabolizer application also calculates “accumulation” values which take into account further degradation of each predicted product. To define the accumulation, it’s useful to introduce an index for the generation level, so that Pi,n is defined as the production of product i in generation n, and fi,n is defined as the formation value for product i in generation n. If product i is further degraded by Ni schemes in generation n+1, the “accumulation” of product i in generation n is calculated according to the following equation:

If product i is a terminal product, then Ni is zero, and Ai,n is equal to Pi,n.
In some cases, it is possible to generate the same product by more than one transformation pathway. For example, if a parent molecule is susceptible to transformation by two schemes, A and B, then the same product might form from an A-B or B-A sequence of transformations. For products that form from more than one pathway, Metabolizer calculates a “global accumulation” as the sum of the accumulation values for that product.
The “formation” values used in Metabolizer have no units; however, for the libraries that we developed in-house, we associate our rank assignments with particular half-life ranges. The figure below shows how formation values (plotted on a logarithmic scale on the left vertical axis) and rate-constants (plotted on a logarithmic scale on the right vertical axis) vary as a function of rank. To be consistent with the Metabolizer algorithm, the half-life ranges were selected so that the rate constants associated with the midpoints of each half-life range would plot along a line with the approximately the same slope as that of the formation plotted against the rank.
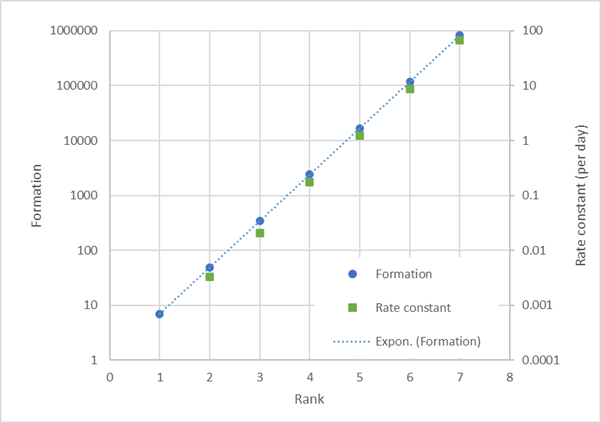
The table below defines the half-life ranges associated with each rank and provides the numerical values plotted in the figure above. This table can be used to verify that the percent production values calculated with the rate constants are roughly the same as the percent production values calculated with the formation values. For example, for a chemical that can be transformed according to three reaction schemes with ranks 6, 4 and 2, the production percentages are 98%, 2% and <0.1%, respectively, whether these percentages are calculated with the formation values or the midpoint rate constants.
|
Rank |
Formation |
Half-life Range |
Midpoint Half-life (days) |
Midpoint Rate Constant (per day) |
|
1 |
7 |
> 1 year |
--- |
--- |
|
2 |
49 |
60 days ≤ t½ < 1 year |
212.5 |
0.00326 |
|
3 |
343 |
7 days ≤ t½ < 60 days |
33.5 |
0.0207 |
|
4 |
2401 |
24 hours ≤ t½ < 7 days |
4 |
0.173 |
|
5 |
16807 |
200 min ≤ t½ < 24 hours |
0.569 |
1.22 |
|
6 |
117649 |
30 min ≤ t½ < 200 min |
0.0799 |
8.68 |
|
7 |
823543 |
t½ < 30 min |
0.0104 |
66.5 |
REFERENCE
Pirok, 2012. Metabolizer and Humans.
https://chemaxon.com/app/uploads/2012/11/Metabolizer-and-Humans.pdf