Hydrology - Evapotranspiration
NLDAS Evapotranspiration
The North American Land Data Assimilation System (NLDAS) combines North American radar data and satellite data from CMORPH (https://www.cpc.ncep.noaa.gov/products/janowiak/cmorph_description.html). NLDAS has a one-hour time step on a 0.125-degree grid of North America, with an average time delay of four days for data retrieval. NLDAS has data coverage from January 1, 1979 to the present. NLDAS data are reported in UTC (GMT).
GLDAS Evapotranspiration
The Global Land Data Assimilation System (GLDAS) combines satellite data and ground-based observational data to provide evapotranspiration and other meteorological parameters. GLDAS has a three-hour time step on a global 0.25-degree grid. GLDAS-2.1 provides data coverage from January 1, 2000 to present, with an average time delay of one month for data retrieval. GLDAS data are reported in UTC (GMT).
Hamon
The Hamon algorithm calculates Potential Evapotranspiration using temperature data obtained from NLDAS or GLDAS. The following equations are used for the calculation of Hamon PET, where H is the number of daylight hours and Tmean is the average daily temperature:  The following table shows all parameters used and produced by the algorithm along with their units:
The following table shows all parameters used and produced by the algorithm along with their units:| Parameter | Units | Type |
|---|---|---|
| Min/Max/Mean Temperature | Celsius | Input |
| Sunshine Hours | hours | Output |
| Potential Evapotranspiration | in/day | Output |
Hargreaves
The Hargreaves algorithm calculates Potential Evapotranspiration using temperature data obtained from NLDAS, GLDAS, or Daymet. The following equations are used for the calculation of Hargreaves PET, where H0 is the extraterrestrial radiation in MJ m-2 d-1 and Tmn, Tmx, Tav are the minimum, maximum, and average daily temperatures in celsius: 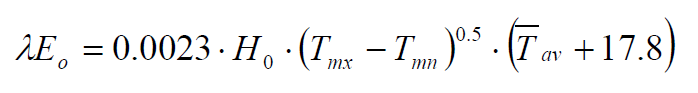 The following table shows all parameters used and produced by the algorithm along with their units:
The following table shows all parameters used and produced by the algorithm along with their units:| Parameter | Units | Type |
|---|---|---|
| Min/Max/Mean Temperature | Celsius | Input |
| Mean Solar Radiation | MJ m-2 d-1 | Input |
| Potential Evapotranspiration | in/day | Output |
Penman
The Penman algorithm calculates Potential Evapotranspiration using temperature, solar radiation, specific humidity, and wind speed data obtained from NLDAS. Note that the Penman algorithm also requires pressure data, which is only available from GLDAS, so GLDAS pressure data is used regardless of the chosen data source. The images below show the main Penman ET equation as well as the equations used to calculate the individual parameters: 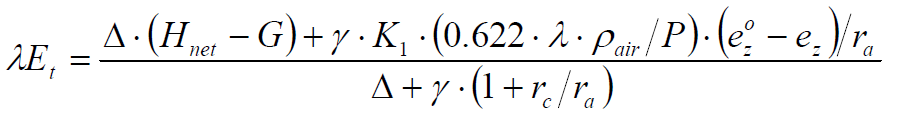
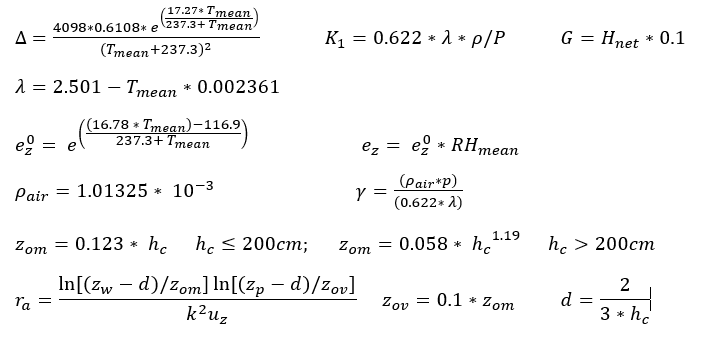
where Δ is the slope of the saturation vapor pressure-temperature curve (kPa °C-1), Hnet is the net radiation (MJ m-2 d-1), G is the heat flux density (MJ m-2 d-1), ρair is the air density (kg m-3), cp is the specific heat (MJ kg-1 °C-1), e0z is the saturation vapor pressure (kPa), ez is the water vapor pressure (kPa), γ is the psychrometric constant (kPa °C-1), rc is the plant canopy resistance (sm-1), ra is the diffusion resistance (sm-1), and Tmean is the average daily temperature (°C). The following table shows all parameters used and produced by the algorithm along with their units:
Further documentation of the above algorithms can be found here:
Neitsch, S. L., Arnold, J. G., Kiniry, J. R., & Williams, J. R. (2005, January). Soil Water and Assessment Tool Theoretical Documentation. Retrieved from https://swat.tamu.edu/media/1292/SWAT2005theory.pdf
where Δ is the slope of the saturation vapor pressure-temperature curve (kPa °C-1), Hnet is the net radiation (MJ m-2 d-1), G is the heat flux density (MJ m-2 d-1), ρair is the air density (kg m-3), cp is the specific heat (MJ kg-1 °C-1), e0z is the saturation vapor pressure (kPa), ez is the water vapor pressure (kPa), γ is the psychrometric constant (kPa °C-1), rc is the plant canopy resistance (sm-1), ra is the diffusion resistance (sm-1), and Tmean is the average daily temperature (°C). The following table shows all parameters used and produced by the algorithm along with their units:
| Parameter | Units | Type |
|---|---|---|
| Elevation (Derived from Lat/Long) | m | Input |
| Albedo Coefficient | Double | Input |
| Min/Max/Mean Temperature | Celsius | Input |
| Mean Solar Radiation | mJ/m2 | Input |
| Mean Wind Speed | m/s | Input |
| Specific Humidity | kg/kg | Input |
| Mean Pressure | mbar | Input |
| Min/Max Relative Humidity | % | Output |
| Potential Evapotranspiration | in/day | Output |
Further documentation of the above algorithms can be found here:
Neitsch, S. L., Arnold, J. G., Kiniry, J. R., & Williams, J. R. (2005, January). Soil Water and Assessment Tool Theoretical Documentation. Retrieved from https://swat.tamu.edu/media/1292/SWAT2005theory.pdf
Temporal Aggregations
The available temporal aggregations are dependent upon the native timestep size of the data source. Possible options include 'daily', for those sources which are not by default daily, and 'monthly'. Aggregated evapotranspiration data are the totals over these time periods and provided in the aggregated timeseries. Monthly aggregations correspond to the calendar month, and require the entire month to be specified in the date time span.